
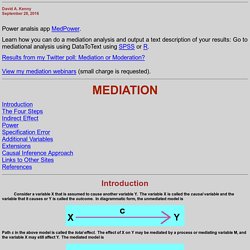
Mediation (David A. Kenny) Some might benefit from Muthén (2011).
Note that both the CDE and the NDE would equal the regression slope or what was earlier called path c' if the model is linear, assumptions are met, and there is no XM interaction affecting Y, the NIE would equal ab, and the TE would equal ab + c'. In the case in which the specifications made by traditional mediation approach (e.g., linearity, no omitted variables, no XM interaction), the estimates would be the same. Here I give the general formulas for the NDE and NIE when X is an intervally measured based on Valeri & VanderWeele, (2013).
If the XM effect is added to the Y equation, that equation can be stated as and the intercept in the M equation can be denoted as iM. Where X0 is a theoretical baseline score on X or a "zero" score and X1 is a theoretical "improvement" score on X or "1" score. When X is a dichotomy, it is fairly obvious what values to use for X0 and X1. References Baron, R. Est2-tablas-imp.pdf (objeto application/pdf) Interactive Mediation Tests. © 2010-2014,Kristopher J.
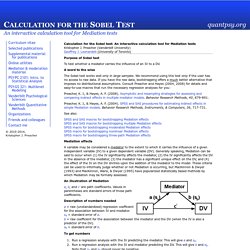
Preacher Calculation for the Sobel test: An interactive calculation tool for Mediation tests Kristopher J. Preacher (Vanderbilt University)Geoffrey J. Leonardelli (University of Toronto) Purpose of Sobel test To test whether a mediator carries the influence of an IV to a DV. A word to the wise The Sobel test works well only in large samples. - SEMNET Information. The Structural Equation Modeling Discussion Network Researchers who study or apply structural equation modeling methods may be interested in an electronic mail network called SEMNET.

Operating over the Internet, SEMNET is an open forum for ideas and questions about the methodology that includes analysis of covariance structures, path analysis, and confirmatory factor analysis. SEMNET bridges the gaps between users, between disciplines, and between conferences. SEMNET was founded in February 1993. As of November 1998, SEMNET had more than 1,500 subscribers around the world. SEMNET is for sharing ideas about this methodology with other interested researchers. The current postmaster/list owner for SEMNET is Dr. Interacting with SEMNET involves sending two different types of e-mail: commands and messages. SEMNET users need to remember two different e-mail addresses--one for commands and one for messages.Commands are always sent to the LISTSERV address: To join SEMNET, send the command:
Software Information. SPSS Learning Module: Using SPSS functions for making and recoding variables. SPSS Learning Module Using SPSS functions for making and recoding variables 1.

Introduction SPSS has a wide variety of functions you can use for creating and recoding variables. Mplus Home Page. Quadratic Regression Calculator. What is Quadratic Regression?

Quadratic regression is a form of multiple linear regression since the equation y = ax² + bx + c is linear in the variables a, b, and, c, which are the undetermined coefficients of the quadratic equation in x. Since a, b, and c are bound in a linear relationship, you can use the least squares method to find the "best" values of a, b, and c. Fiabilidad (psicometría) En el campo de la psicología, la educación y la investigación social, la fiabilidad (también llamada técnicamente confiabilidad) es una propiedad psicométrica que hace referencia a la ausencia de errores de medida, o lo que es lo mismo, al grado de consistencia y estabilidad de las puntuaciones obtenidas a lo largo de sucesivos procesos de medición con un mismo instrumento.

Es necesario aclarar que la fiabilidad no es una propiedad de los tests en sí mismos, sino de las interpretaciones, inferencias o usos específicos que se hagan a partir de los datos y medidas que estos proporcionan. Asimismo, no puede hablarse de la fiabilidad en términos absolutos; sí cabría hablar del grado de fiabilidad que puedan presentar los instrumentos de medida en un contexto de aplicación determinado. A partir de la variabilidad en las puntuaciones encontradas tras una serie de mediciones repetidas puede determinarse el índice de precisión, consistencia y estabilidad de un instrumento.
Donde. Chi-square table. Methodspace - home of the Research Methods community. Index page – SPSSforum.com the largest SPSS community worldwide. StatNotes: Topics in Multivariate Analysis, from North Carolina State University, Public Administration Program. Looking for Statnotes?
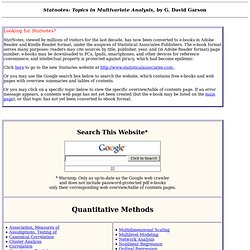
StatNotes, viewed by millions of visitors for the last decade, has now been converted to e-books in Adobe Reader and Kindle Reader format, under the auspices of Statistical Associates Publishers. The e-book format serves many purposes: readers may cite sources by title, publisher, year, and (in Adobe Reader format) page number; e-books may be downloaded to PCs, Ipads, smartphones, and other devices for reference convenience; and intellectual property is protected against piracy, which had become epidemic. Click here to go to the new Statnotes website at . Or you may use the Google search box below to search the website, which contains free e-books and web pages with overview summaries and tables of contents. Or you may click on a specific topic below to view the specific overview/table of contents page. Statistics Hell.