
Fusion Tables map styling - what are your options? Kathryn Hurley, Developer Programs Engineer, Fusion Tables August 2011 Fusion Tables offers two map feature styling options: styling via the Fusion Tables API and styling via the Google Maps API.
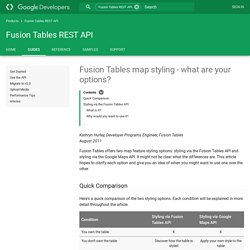
It might not be clear what the differences are. This article hopes to clarify each option and give you an idea of when you might want to use one over the other. Quick Comparison Here's a quick comparison of the two styling options. Fusion Tables Layer Example: IN query Fusion Tables Layer Example: Update Query Fusion Tables Layer Example: Multiple Layers per Map Fusion Tables REST API An easy way to learn how to use an API is to look at sample code.
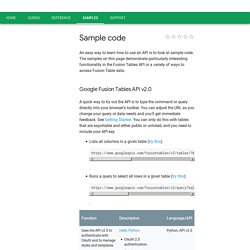
The samples on this page demonstrate particularly interesting functionality in the Fusion Tables API or a variety of ways to access Fusion Table data. Google Fusion Tables API v2.0 A quick way to try out the API is to type the command or query directly into your browser's toolbar. You can adjust the URL as you change your query or data needs and you'll get immediate feedback. See Getting Started. Customize map info windows - Fusion Tables Help. By default, Fusion Tables draws a little bit of data from the table and displays it in the info window that appears when a viewer clicks on a map feature.
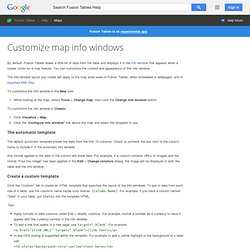
You can customize the content and appearance of this info window. The info window layout you create will apply to the map when seen in Fusion Tables, when embedded in webpages, and in exported KML files. To customize the info window in the New look: While looking at the map, select Tools > Change map, then click the Change info window button. FusionTablesLayer Wizard. Derekeder/FusionTable-Map-Template. Cómo hacer una mapa con “Google Fusion Tables” – Guía practica.
Cada día es posible encontrar más bases con datos sobre ubicaciones, y también aplicaciones que podemos usar para realizar mapas de manera sencilla.
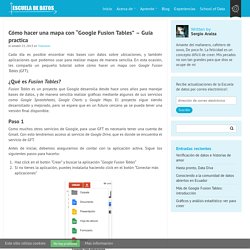
Cómo hacer una mapa con “Google Fusion Tables” – Guía practica. How to Make a Map with Excel Data Using Google Fusion Tables - Geolounge. Ad There is an oft repeated yet unsubstantiated claim that 80% of all data has a geographic component.
Likewise, some have claimed that Excel is one of the most popular and important pieces of software currently in use. There is a lot of data available in Excel files, many of which have locational attributes stored within the columns. If you have an Excel spreadsheet that columns location data (e.g addresses, ZIP codes, city, country, or coordinates), there is an easy way to map your Excel data using Google Fusion Tables. This article will take you though a step-by-step example of using an Excel spreadsheet that contains location information to make a map using Google Fusions Table.
For this example, an Excel file containing the rank of Fortune 1000 companies for 2014 will be used. Change placemark icon - Fusion Tables Help. By default, point locations are shown on the map with a small red dot icon.
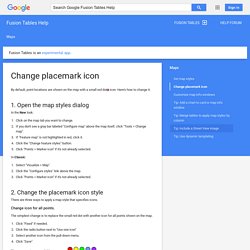
Here's how to change it. 1. Open the map styles dialog In the New look: Google Geo Developers Blog. Google Geo Developers Blog: Search your geo data using spatial queries from Fusion Tables! I’m Kathryn Hurley, a Developer Programs Engineer for Fusion Tables, and I have to say, I really dig Fusion Tables.
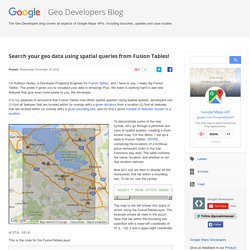
The power it gives you to visualize your data is amazing! Plus, the team is working hard to add new features that give even more power to you, the developer. How to make a map in Google Fusion Tables. Fusion Tables Layer in Google Maps API - Fusion Tables Help. Maps in Fusion Tables are also available as Fusion Tables Layers in the Google Maps API.
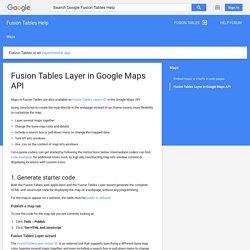
Using JavaScript to create the map directly in the webpage instead of an iframe means more flexibility to customize the map: Layer several maps together Change the base map color and details Include a search box or pull-down menu to change the mapped data Turn off info windows Use .css on the content of map info windows Cut-n-paste coders can get started by following the instructions below.
Intermediate coders can find code examples for additional tricks such as logically constructing map info window content or displaying locations with custom icons. Mapping with Google Fusion Tables. Earlier this year I created a lab assignment for Sally Hermansen’s Advanced Cartography course at the University of British Columbia.
The purpose of this lab was to introduce students to Google Maps and managing data in Google Fusion Tables. I’m posting it here in case anyone else finds it useful. I’d also like to thank Sally’s TA Sam Walker for his help testing this assignment. For that course I also created a short QuantumGIS tutorial, which I will post separately: A Very Short Introduction to QGIS. How to Create a Google Map With Excel Data and Fusion Tables - 16 Easy Steps. Make a table accessible - Fusion Tables Help. By default, new tables are private, requiring other people to be invited with specific permissions and sign in before viewing or editing the data.
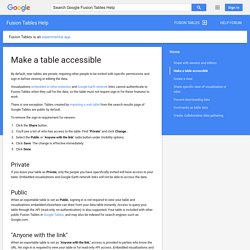
Visualizations embedded in other websites and Google Earth network links cannot authenticate to Fusion Tables when they call for the data, so the table must not require sign-in for these features to work. There is one exception: Tables created by importing a web table from the search results page of Google Tables are public by default. To remove the sign-in requirement for viewers: Click the Share button. You'll see a list of who has access to the table. Private If you leave your table as Private, only the people you have specifically invited will have access to your table. Public When an exportable table is set as Public, signing in is not required to view your table and visualizations embedded elsewhere can draw from your data table instantly.
"Anyone with the link" Fusion Tables Layer (Experimental) Fusion Tables API. Important: Fusion Tables API v1.0 restricts the maximum response size to 10 MB. We encourage you to migrate to the Google Fusion Tables API v2.0, which provides media download for large payloads. Get started There are lots of ways to get started with Fusion Tables. Dive into sample code, follow a tutorial, or join our community. Create, update, and delete. Create: a map - Fusion Tables Help. Use Fusion Tables' new look with this tutorial This 2-3 minute tutorial steps you through uploading data to generate a map with placemarks in the new version of Fusion Tables.
For this tutorial, a sample dataset is provided containing records of insects collected in Costa Rica by ecologists. Each location is recorded with a latitude and longitude point. Import the sample dataset Download this sample insect dataset. Mapa interactivo con Google Fusion Tables. Deja un comentario Actualizado el 19 de octubre de 2015 Fusion Tables es una de esas aplicaciones que viven en eterna beta.
Aunque su desarrollo comienza en 2009, no es hasta 2011 cuando se convierte en un producto independiente relacionado con Google Docs, el actual Google Drive. Como detectar y mostrar la localización geográfica en las páginas web. Códigos para mostrar en las páginas de un blog o sitio web la latitud, longitud, altura y un mapa con la ubicación geográfica de los lectores, usando la API de Geolocalización del W3C. Hay varias formas de determinar la localización y ubicación geográfica de las personas cuando acceden a internet.
Es sumamente útil para los sitios y empresas en internet que ofrecen servicios que difieren de acuerdo a la ubicación de los visitantes. También para las aplicaciones y programas que usamos en nuestro dispositivo o equipo. Podemos determinar y mostrar la localización de nuestros lectores en las páginas de nuestro blog o sitio de internet, para realizar distintas acciones, ofrecer contenido o mensajes de acuerdo al país, un formato o lenguaje diferente, etc. y de esa forma hacerlas más útiles, dinámicas y atractivas. Códigos para crear y mostrar mapas de Google Maps. Insertar mapas en un blog o página web o cargarlos desde la PC usando la nueva API 3 de Google. Como crear marcadores, globos o cuadros con información y mostrar imágenes y fotos en el mapa.
Códigos para copiar y pegar o descargar con varios ejemplos prácticos. En otra página de este sitio mostramos varios ejemplos de cómo insertar mapas de Google Maps en las páginas de un sitio, pero usando la anterior versión 2 de la API de Google. Google Maps API Styled Map Wizard. Navigate to the map region you wish to use to preview your style. Jump to a particular location using the Enter a location field in the top right. Select a type of feature to style in the Selectors panel. If you only wish to style the Geometry or Labels for the selected feature type, select the required Element Type.
Select the combination of Stylers to apply to the selected feature type. Once you are happy with the styling of the feature type, click the Add button in the Map Style panel to save the style and create a new style to work on. Google Maps Javascript API Overview Styled maps allow you to customize the presentation of the standard Google base maps, changing the visual display of such elements as roads, parks, and built-up areas. There are two ways to apply styles to a map: By setting the .styles property of the map's MapOptions object. This approach changes the style of the standard map types (base imagery in terrain and satellite views is not affected, but roads, labels, etc. respect styling rules).
See Changing the Default Map Style. Both approaches take an array of MapTypeStyles, each of which is composed of selectors and stylers. Google Maps Javascript API The JavaScript code for the Maps API is loaded via a bootstrap URL of the form This bootstrap request loads all of the main Javascript objects and symbols for use in the Maps API. Some Maps API features are also available in self-contained libraries which are not loaded unless you specifically request them. Breaking up supplemental components into libraries allows the main API to load (and parse) quickly; you only incur the additional overhead of loading and parsing libraries if you need them. You specify additional libraries to load within the bootstrap request by specifying a libraries parameter, passing that parameter the name of the library or libraries.
Multiple libraries may be specified as a comma-separated list. Once loaded, libraries are accessed via the google.maps. namespace. Google API Tutorial. Google Maps API. Introducing the Google Maps JavaScript API V3. My, how time flies. More than five years ago I penned the first of what has since turned out to be a pretty lengthy -- not to mention popular -- series covering various facets of the Google Maps API.
(If you'd like to check out the previous 12 installments, I've assembled a compendium on my blog.) Over the course of these five years, the API developers have continued to expand and improve the product, elevating the project to a level at which what you can do with the API is limited only by your imagination. On May 19, 2010, the API took another evolutionary step forward with the release of version 3, better known as Google Maps JavaScript API V3. In addition to significantly streamlining the JavaScript-based syntax used to create maps, add markers, and perform other tasks, the API has been optimized for use within both mobile applications and the traditional desktop environment.
Places search box - Google Maps JavaScript API.