

Fun With Canvas: Create a Bar Graphing Plugin, Part 1. In this two-part series, we'll combine the versatile canvas element with the robust jQuery library to create a bar graphing plugin.
In this first part, we are going to code the core logic of the plugin as a standalone version. Today, we are going to create a bar graphing plugin. Not an ordinary plugin, mind you. Using Microsoft's Chart Controls In An ASP.NET Application: Creating Drill Down Reports. By Scott Mitchell Introduction Each series in a chart is composed of a set of data points, which are modeled via the DataPoint class.
For most chart types, the two key attributes of a data point are its X and Y value. For example, in a line chart the X value indicates the position of the data point along the X axis, while the Y value represents the position of the data point along the Y axis. Ditto for a column chart, although it may help to think of the Y value as the height of the column. In addition to X and Y values, data points can include additional bits of information, including an associated URL. This article examines how to build drill down reports. Using Microsoft's Chart Controls In An ASP.NET Application: Enhancing Charts With Ajax. By Scott Mitchell Introduction Charts are typically used to provide a static snapshot of data.
The chart's underlying data might be based on various user inputs, but in the end the chart, once rendered, represents the end of the reporting workflow. However, other scenarios allow for a more interactive user experience. For example, in the Creating Drill Down Reports article we looked at how to configure the Chart control to allow the user to drill into a particular data point. Ajax is a set of related techniques used in websites to build more interactive and responsive applications. Read on to learn more! Displaying Drill Down Data On The Same Page The Microsoft Chart controls offer two techniques for building drill down reports: By setting the Url property of the points in the chart, or By setting the the Series' PostBackValue property and creating an event handler for the Chart's Click event.
Note the second input parameter - it's of type ImageMapEventArgs. Confused yet? Further Reading. Using Microsoft's Chart Controls In An ASP.NET Application: Getting Started. By Scott Mitchell Introduction A picture is worth a 1,000 words...
This adage rings especially true when it comes to reporting. Charts summarize and illuminate patterns in data in a way that long tables of numbers simply cannot. Web developers have long searched for ways to express numerical data in a graphical format; until recently, doing so required the use of an open source or third-party charting or reporting package or some homegrown technique using HTML, GDI+, or some other technology. The Microsoft Chart Controls are an encompassing set of charts for WinForms and ASP.NET applications. While the Microsoft Chart Controls have some rough edges, their cost (free), number of chart types, and array of supported charting features make them an excellent choice for adding charts to an ASP.NET web application.
Introducing the New Chart Control in Visual Studio 2010. Generating Google line charts with SQL, part I. In this series of posts I wish to show how Google Charts can be generated via SQL.
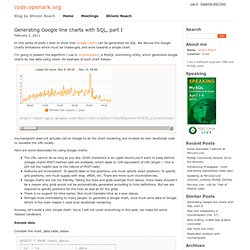
We discuss the Google Charts limitations which must be challenged, and work towards a simple chart. I'm going to present the algorithm I use in mycheckpoint, a MySQL monitoring utility, which generates Google charts by raw data using views. An example of such chart follows: mycheckpoint does not actually call on Google to do the chart rendering, but invokes its own JavaScript code to visualize the URL locally. Here are some downsides for using Google charts: The URL cannot be as long as you like. 2048 characters is an upper bound you'll want to keep behind.
Anyway, let's build a very simple chart. Sample data Consider the chart_data table, below: Find complete SQL script in google_charts.sql In the above table we assume the timestamp values are evenly distributed. Axis boundaries By default, Google Charts expect data to lie within the range 0..100. In our example we will just settle with the min/max values. Displaying Data in a Chart (Part 1)
Displaying Data in a Chart (Part 2) Generating Google line charts with SQL, part I. In this series of posts I wish to show how Google Charts can be generated via SQL.
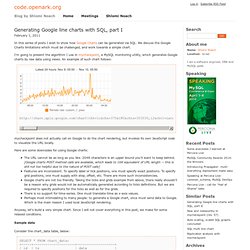
We discuss the Google Charts limitations which must be challenged, and work towards a simple chart. I'm going to present the algorithm I use in mycheckpoint, a MySQL monitoring utility, which generates Google charts by raw data using views. An example of such chart follows: mycheckpoint does not actually call on Google to do the chart rendering, but invokes its own JavaScript code to visualize the URL locally. Here are some downsides for using Google charts: The URL cannot be as long as you like. 2048 characters is an upper bound you'll want to keep behind.
Anyway, let's build a very simple chart.