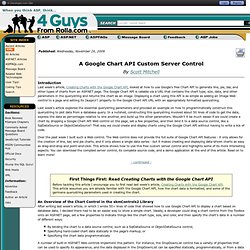

Charts Gallery - Image Charts (Deprecated) A Google Chart API Custom Server Control. By Scott Mitchell Introduction Last week's article, Creating Charts with the Google Chart API, looked at how to use Google's free Chart API to generate line, pie, bar, and other types of charts from an ASP.NET page.

The Google Chart API is callable via a URL that contains the chart type, size, data, and other parameters in the querystring and returns the chart as an image. Displaying a chart using this API is as simple as adding an Image Web control to a page and setting its ImageUrl property to the Google Chart API URL with an appropriately formatted querystring. Last week's article explored the essential querystring parameters and provided an example on how to programmatically construct this querystring to plot data from a database query.
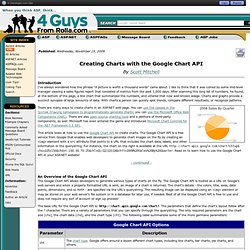
Over the past week I built such a Web control. An Overview of the Chart Control in the skmControls2 Library The Chart control is used in the following manner: a page developer adds the Chart control to an ASP.NET page. Conclusion Happy Programming! Creating Charts with the Google Chart API. By Scott Mitchell Introduction I've always wondered how the phrase "A picture is worth a thousand words" came about.

I like to think that it was coined by some mid-level manager viewing a sales figures report that consisted of metrics from the past 1,000 days. After scanning this long list of numbers, he found, at the bottom of the page, a line chart that summarized the numbers, and uttered that now well-known adage. Charts and graphs provide a succinct synopsis of large amounts of data. There are many ways to create charts in an ASP.NET web page. This article looks at how to use the Google Chart API to create charts. An Overview of the Google Chart API The Google Chart API allows developers to generate various types of charts on the fly.
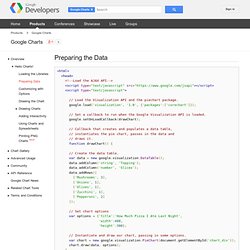
The base URL for the Google Chart API is: The parameters that define the chart's layout follow after the ? Using the above information you can tinker with creating your own charts using the Google Chart API. And you get the following results: Conclusion. Preparing the Data - Google Chart Tools. // Callback that creates and populates a data table, // instantiates the pie chart, passes in the data and // draws it. function drawChart() { // Instantiate and draw our chart, passing in some options. var chart = new google.visualization.PieChart(document.getElementById('chart_div')); chart.draw(data, options); } </script> </head> All charts require data.

Google Chart Tools charts require data to be wrapped in a JavaScript class called google.visualization.DataTable. This class is defined in the Google Visualization library that you loaded previously. A DataTable is a two-dimensional table with rows and columns, where each column has a datatype, an optional ID, and an optional label.
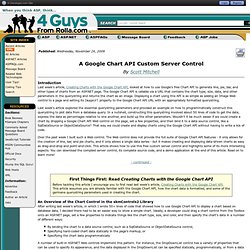
There are several ways to create a DataTable; you can see a list and comparison of each technique in DataTables and DataViews. DataTables and DataViews - Google Chart Tools. Code Playground. A Google Chart API Custom Server Control. By Scott Mitchell Introduction Last week's article, Creating Charts with the Google Chart API, looked at how to use Google's free Chart API to generate line, pie, bar, and other types of charts from an ASP.NET page.

The Google Chart API is callable via a URL that contains the chart type, size, data, and other parameters in the querystring and returns the chart as an image. Displaying a chart using this API is as simple as adding an Image Web control to a page and setting its ImageUrl property to the Google Chart API URL with an appropriately formatted querystring. Last week's article explored the essential querystring parameters and provided an example on how to programmatically construct this querystring to plot data from a database query. Over the past week I built such a Web control. An Overview of the Chart Control in the skmControls2 Library The Chart control is used in the following manner: a page developer adds the Chart control to an ASP.NET page.
Conclusion Happy Programming!